[IR]
Discover
Discover
Latest info
Investment case
Download latest report
Q1 2026
Learn more
Our brand and products
Vision, business concept, goals and strategy
Our story
Geographical markets
Business model
Financials
Financials
Reports
Calendar
Financial objectives
Financial risks
Analyst reports
Tax return info
Data
Key figures, shareholders, & the share
Report archive
Governance
Governance
Annual general meetings
Governance reports
Management & board
Additional documents
Press releases
Sustainability
Media
Careers
Contact
Suggested searches
Reports
Why invest
Financials
Dashboard
Key figures
Shareholders
Share & dividend
Download latest report
Key figures
Quarterly KPIs
Net sales development per quarter
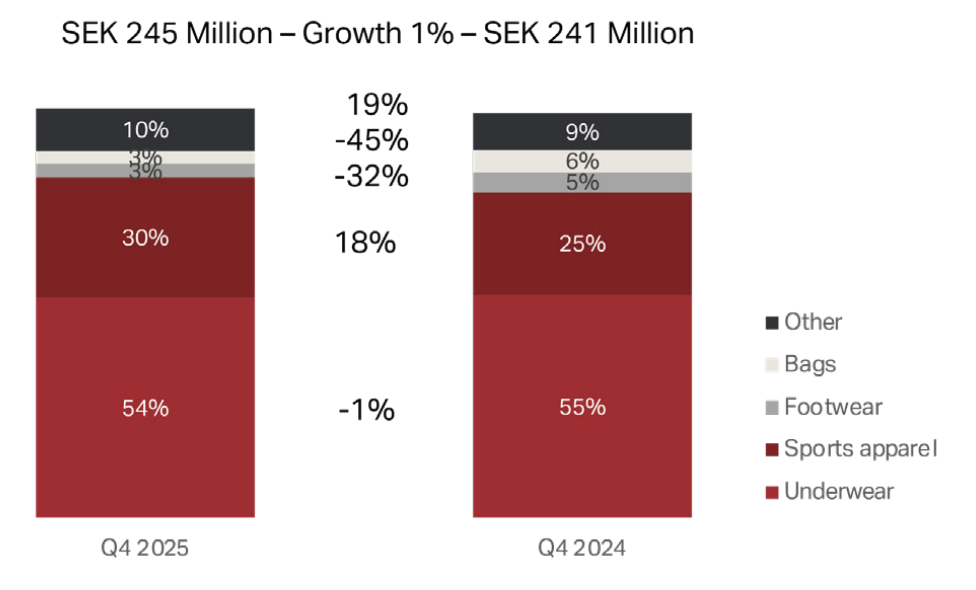
Sales per product
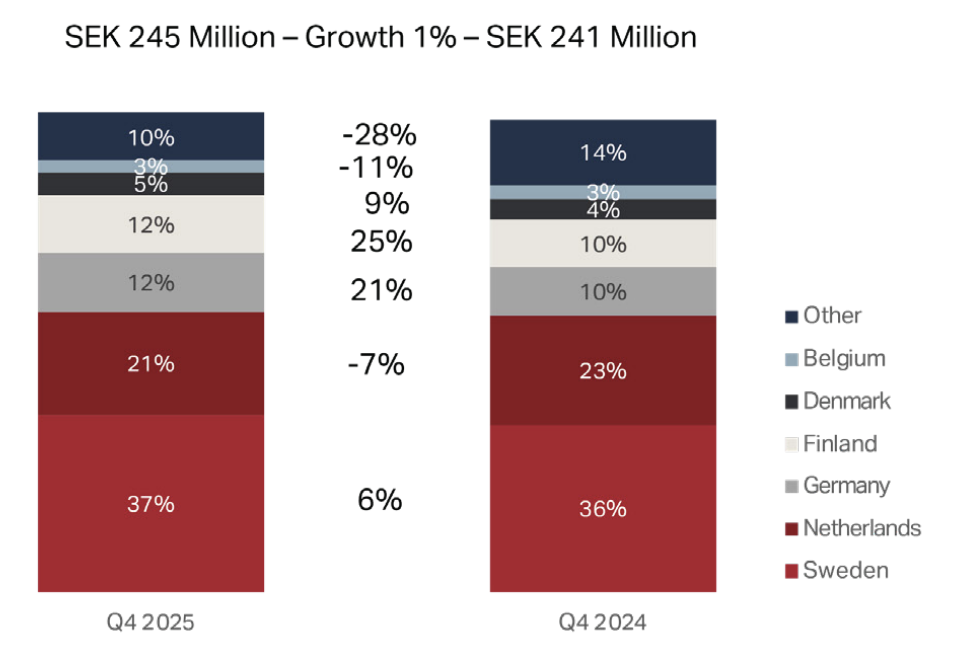
Sales per market
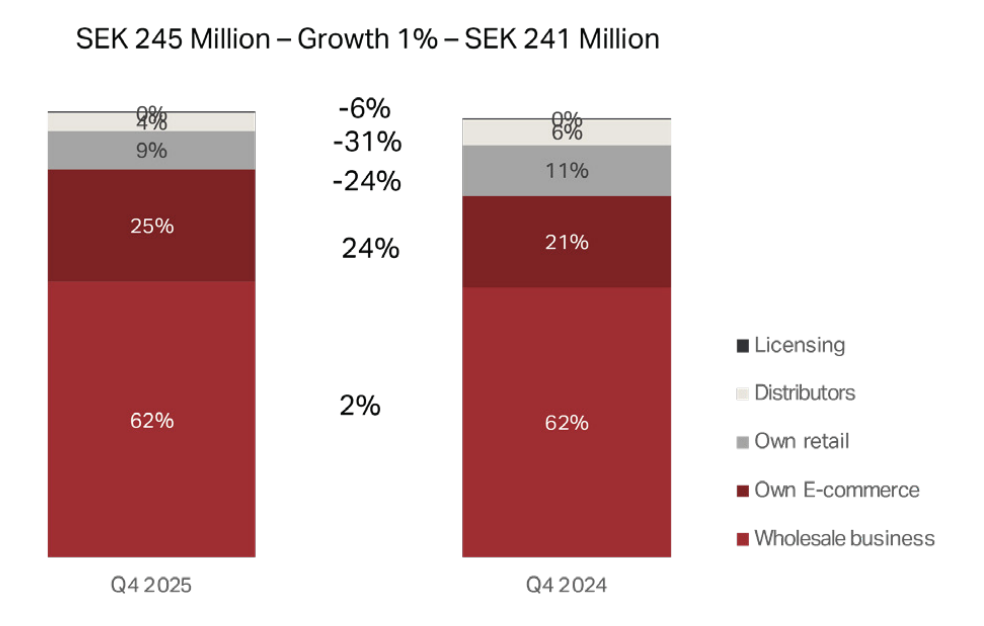
Sales per distribution channel
Financial overview
Income summary
Balance sheet
Website designed and powered by
.com